FVGs · STRUCTURE-BREAK ORDER BLOCKS · ZONE LIFECYCLES
Fair Value Gaps & Order Blocks: TradingView Indicator
Identify fair value gaps and structure-break order blocks, then track retests, fill, invalidation and overlap in one TradingView workspace.
Open Fair Value Gaps & Order Blocks on TradingView ↗ (paid link)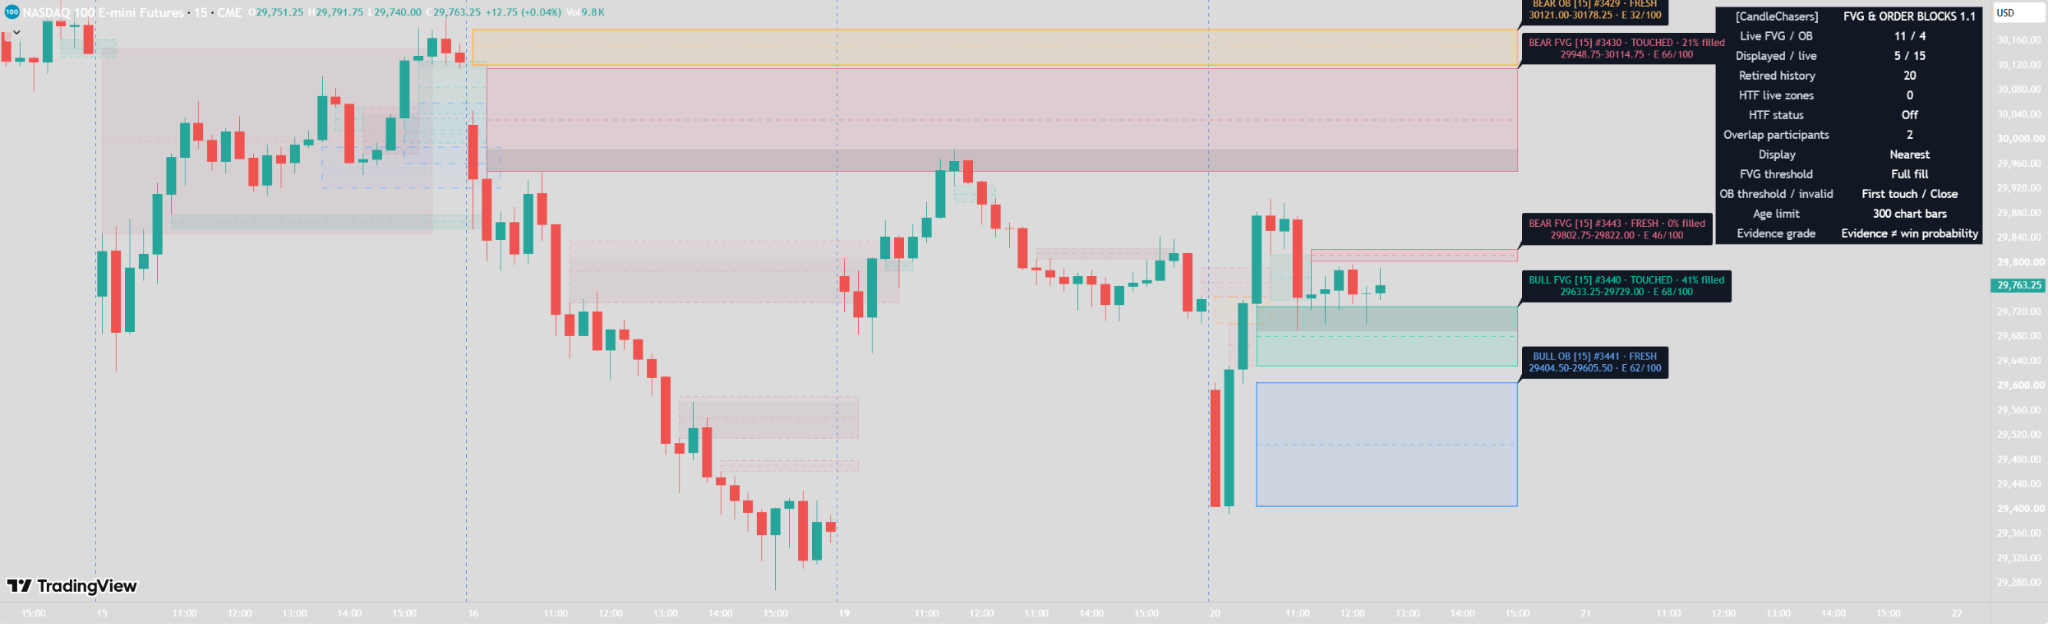
This is a visual analysis indicator. Evidence grades are not win probabilities, and order blocks are price-pattern proxies rather than observed institutional orders.
How fair value gaps form
A bullish FVG forms when the third candle’s low is strictly above the first candle’s high. A bearish FVG forms when the third candle’s high is strictly below the first candle’s low. Equal boundaries do not qualify.
The default minimum gap is 0.1 ATR, using ATR length 14. An optional displacement filter, enabled by default, requires the middle candle to have a directional body of at least 0.5 of its own ATR. The zone retains its original boundaries and 50% midpoint as price revisits it. Session and overnight gaps can qualify; there is no session-continuity filter.
How structure-break order blocks form
An order block is identified at the first confirmed close beyond a previously confirmed swing high or low. Structure pivots default to five candles on each side, so their confirmation is delayed by the right-side bars. Newly confirmed pivots cannot generate a break retroactively on that same candle.
For a bullish break, the script selects the nearest bearish candle before the break. For a bearish break, it selects the nearest bullish candle. The default search window is 20 source candles; dojis and the breakout candle are excluded. Boundaries can use the full candle or its body. The source must not already have invalidated between its origin and detection under the selected invalidation rule.
The optional breakout displacement filter defaults to a directional body of at least 0.6 ATR. A separate optional filter requires a recent same-direction FVG pattern, with a default window of three source bars including the break bar. This is recent pattern confluence, not necessarily an active overlapping gap. Each structure reference gets one closing-break attempt, even if the other filters reject it.
Track fresh, touched and mitigated zones
Active labels identify type, direction, source timeframe, zone ID, state, prices, and evidence grade. A zone begins FRESH, becomes TOUCHED on its first subsequent overlapping candle, and becomes MITIGATED when its selected threshold is reached.
FVG and OB mitigation thresholds are independently selectable:
- First touch: price reaches the near boundary.
- Midpoint: price reaches 50% of the original range.
- Full fill: price reaches the far boundary.
Boundary equality can qualify as a touch. FVGs retire when their selected threshold is reached; Full fill is the default. OBs default to First touch mitigation and can remain live until invalidated or expired. An option retires OBs immediately on mitigation instead.
A bullish FVG invalidates on a strict close below its bottom; a bearish FVG invalidates on a strict close above its top. OB invalidation can use either a close or a wick strictly beyond the far boundary. An exact boundary touch is not invalidation. Invalidation takes priority over touch/fill events. A gap that skips through a zone does not claim an overlapping retest or traded fill.
Chart formation candles do not retest their own newly created chart zones. Expiry takes priority over other lifecycle events. Filled, invalidated, expired, and capacity-retired zones can remain as faint history, with a configurable limit.
Higher-timeframe formation, chart-timeframe management
Optional HTF detection uses the same formation rules, evaluated with the source timeframe’s own candles, ATR, and pivot delays. The selection must be strictly higher than the chart. Invalid equal/lower selections are skipped with dashboard guidance.
All returned source values are offset by one source candle with lookahead_on. This carries completed source results forward instead of leaking an unfinished HTF candle’s final values into earlier chart bars. Each source candle is imported once. A confirmed pattern is observed at the first eligible chart close in the next source period; gaps or non-aligned intervals can delay or miss sampled events.
After import, retests, fill, invalidation, age, and rejection are managed on closed chart candles. An HTF zone can therefore invalidate on a chart close even if the eventual HTF close recovers. The first chart candle after the source close can retest or invalidate a newly imported zone. Formation timeframe and management timeframe are deliberately distinct.
Drawings start at detection/import by default. Optional origin placement draws backward to the pattern’s origin, but does not mean the zone was known at that earlier candle. Projection estimates elapsed chart periods rather than future traded candles, so session gaps can affect its position.
Cumulative fills and FVG/OB overlap
FVG fill percentage records the deepest subsequent overlapping penetration into the original gap, capped at 100%. It never decreases after recovery. A gray overlay shows the cumulatively penetrated portion without shrinking the original zone. This is an OHLC penetration measure, not executed volume or a record of unfilled orders.
Yellow borders highlight live same-direction FVG/OB overlap. Up to six intersections between displayed pairs are shaded, prioritizing newer pairs. Chart and HTF zones can overlap. A shared boundary without positive area does not qualify. Retired zones do not contribute; a hidden live counterpart can still contribute context.
What the evidence grade measures
The label’s E n/100 grade has three disclosed components:
- Displacement: up to 40 points, saturated at 1.5 ATR. FVGs use the middle candle’s directional body and its ATR; OBs use the breakout candle’s directional body and ATR.
- Pattern evidence: up to 40 points, saturated at 0.5 ATR. FVGs use gap height; OBs use close distance beyond the broken pivot.
- Live context: 20 points for any same-direction overlap with the other zone family.
Negative directional bodies contribute zero. If middle-candle ATR is unavailable with displacement gating disabled, displacement contributes zero. Hover a zone label for its point breakdown. Formation components are frozen, while overlap points can change as other zones form or retire. Without overlap, the maximum is 80.
This grade describes these rules. It is not a win probability, a calibrated forecast, or proof of institutional activity.
Keep the chart selective without losing tracking
Nearest mode defaults to three eligible zones above price, three below, and two containing or touching price. Distance is measured to the nearest boundary; ties favor newer IDs. Other controls include untouched-only display, hiding live mitigated OBs, a minimum displayed grade, or showing all live zones.
Display filters hide drawings without removing tracking. Hidden zones still age, fill, invalidate, contribute overlap context, and can alert. Retired history has separate controls and is not filtered by the live nearest/fresh/grade settings.
Optional first-retest rejection markers require the first overlapping candle to close above a bullish zone’s top with a bullish body, or below a bearish zone’s bottom with a bearish body. Invalidation takes priority. A rejection can coexist with mitigation on that candle. Markers and rejection alerts default off and have independent controls; hidden zones can still generate them.
Labels, history and alerts
Default colors distinguish bullish FVGs, bearish FVGs, bullish OBs, and bearish OBs. Price labels and midpoint lines identify active zones. Label size, colors, transparency, dashboard size, and dashboard corner are adjustable. The dashboard uses light text on an opaque dark background. Input values are hidden from the status line.
Live capacity defaults to 30 zones and retained history to 20. Age defaults to 300 chart bars from detection/import for both chart and HTF zones. At capacity, mitigated live OBs are retired first, otherwise the oldest live zone. Age/capacity cleanup is housekeeping and does not emit price-event alerts. More zones and labels can increase chart load or overlap visually.
Twelve named alert conditions cover new zones by direction/type, separate FVG/OB first retests, FVG fill threshold, OB mitigation, separate invalidations, and bullish/bearish first-retest rejections. Use Once Per Bar Close.
Choose Any alert() function call for an aggregated message containing enabled events with symbol, chart timeframe, source timeframe, zone ID, and boundaries. Multiple zone events on one candle are joined into one message. Recreate saved alerts after changing code or settings.
Get started in TradingView
- Add the indicator to a standard time-based candlestick chart.
- Start with chart zones and Nearest display.
- Select mitigation and invalidation rules that match how you intend to review zones.
- Optionally enable a strictly higher source timeframe.
- Hover labels to inspect source, prices, state, and evidence components.
- Reduce history or tighten display filters if the chart becomes crowded.
Purpose and limitations
FVGs, pivots, and order-block conventions are established concepts. This implementation combines one shared formation detector across chart/HTF contexts, a consistent zone lifecycle, preserved boundaries with cumulative fill tracking, cross-family overlap, disclosed grade components, and display filtering that preserves tracking and alerts. Those components serve a single workflow: comparing the origin, state, and context of price zones.
The script is a visual analysis indicator. It places no orders, provides no strategy backtest or verified win rate, and makes no profitability claim. Order blocks are price-pattern proxies, not observed institutional orders. Historical data availability, input changes, feed revisions, ATR warmup, and pivot confirmation delays can change recalculated results. Standard aligned time-based candles are recommended. No pattern, overlap, grade, or rejection guarantees that a zone will hold or that price will revisit it.
Common questions
Does a fair value gap have to fill?
No. A zone can remain untouched, expire or invalidate. A pattern does not guarantee that price will revisit it.
Does a 68/100 grade mean a 68% chance of success?
No. The grade summarizes disclosed displacement, pattern and overlap components. It is not a calibrated forecast or win probability.
Are higher-timeframe zones managed by higher-timeframe closes?
Formation uses completed source-timeframe candles. After import, lifecycle decisions use closed chart candles. A chart close can therefore invalidate an HTF zone even if the later HTF close recovers.
Does hiding a zone stop its alerts?
No. Display filtering does not remove tracking. Hidden live zones can still fill, age, invalidate, contribute overlap context and generate enabled alerts.
Does origin placement mean a zone was known earlier?
No. Optional origin placement draws backward to the pattern origin. The zone becomes known only at detection or import, including pivot confirmation delays.
For a broader sequence combining liquidity sweeps and structure shifts, explore Smart Money Concepts Pro. For selective swing levels, see Support & Resistance.
Open Fair Value Gaps & Order Blocks on TradingView ↗ (paid link)