TREND CONTEXT · PRICE ACTION · VOLATILITY · RISK PLANNING
Strong Trend & Risk Planner: TradingView Indicator
Read the trend context. Inspect completed candles. Estimate hypothetical position risk before confusing a market observation with a trade plan.
Open Strong Trend & Risk Planner on TradingView ↗ (paid link)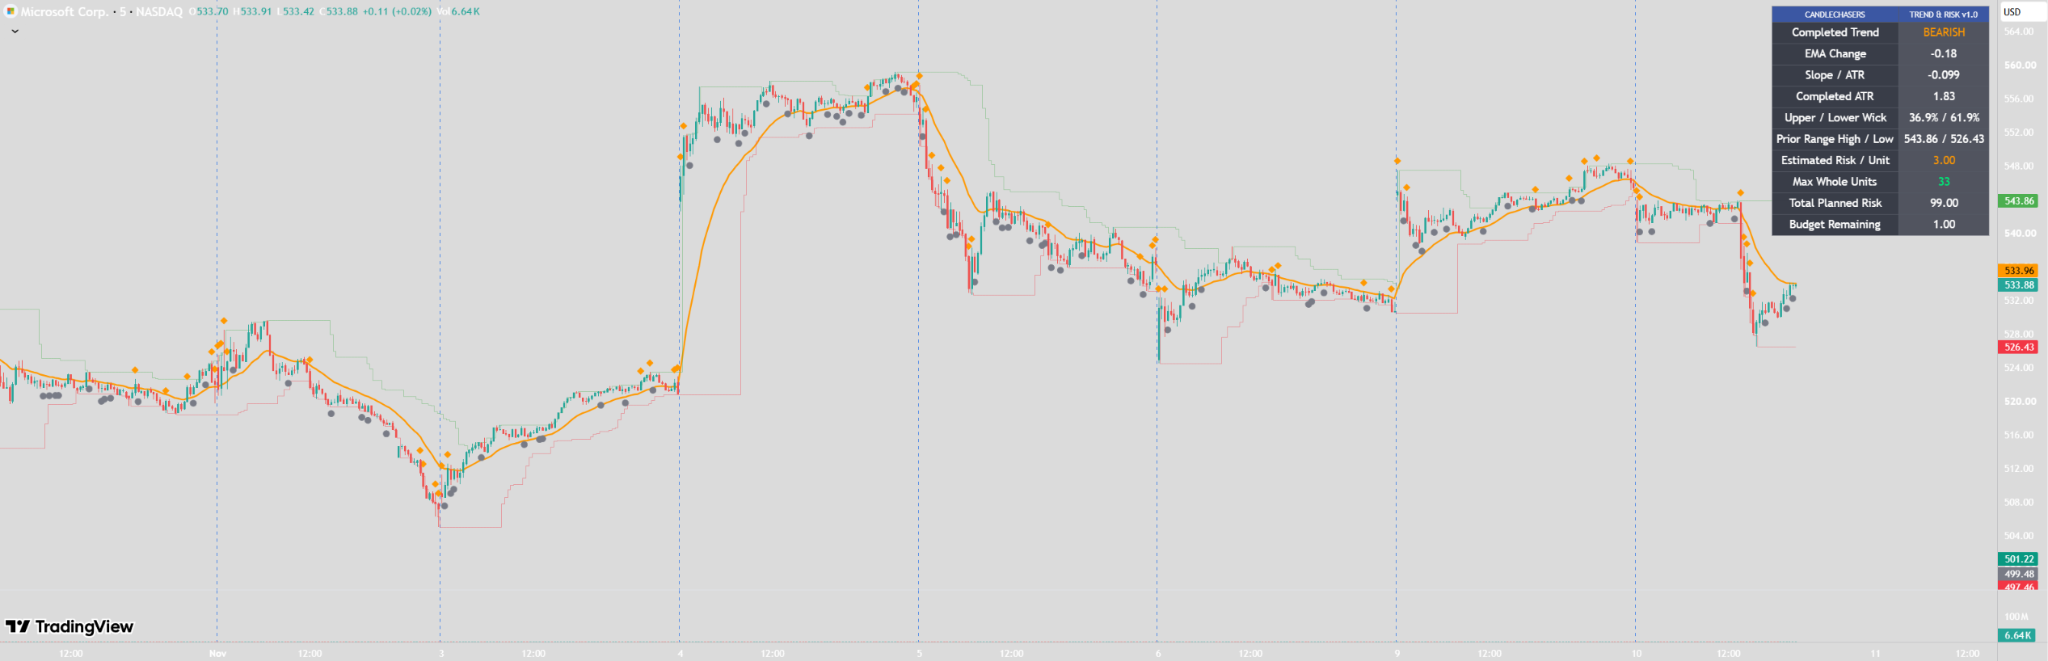
The dashboard describes conditions under its selected EMA, candle and ATR rules. It does not predict continuation, place orders or establish a trading edge. The position planner is an arithmetic estimate under your assumptions.
What Strong Trend & Risk Planner measures
CandleChasers – Strong Trend & Risk Planner combines exponential moving average measurements, historical price ranges, candle structure and Average True Range in one configurable chart display. Its completed-bar dashboard keeps directional context and hypothetical risk calculations visible alongside the chart.
Five trend states, with an explicit strong-trend threshold
The indicator classifies recent conditions as Strong Bullish, Bullish, Neutral / Mixed, Bearish or Strong Bearish. Classification uses EMA direction, the EMA change normalized by ATR, and the position of three completed candle closes relative to the EMA.
A strong classification also requires the normalized EMA change to meet the selected threshold. Changing that threshold changes the mathematical definition being applied; it does not establish that the resulting label is a more profitable signal.
Inspect inside bars and large-range candles
| Observation | What qualifies | What it does not establish |
|---|---|---|
| Inside bar | A completed candle whose range remains within the preceding candle’s range. | A breakout direction, entry price or probability of success. |
| Large-range candle | A completed candle with a high-to-low range exceeding the configured multiple of the previous completed ATR value. | A guaranteed continuation move or a suitable order size. |
The large-range measurement uses the whole high-to-low range, rather than just the candle body. Both marker types describe completed price action. They are observations to review in context, not instructions to trade.
Use rolling extremes as historical context
Rolling high and low levels summarize previous price extremes. They provide a repeatable historical range reference. They are not discretionary trend channels or a reconstruction of hand-drawn support and resistance.
Read the levels alongside the selected lookback and the market being studied. A historical extreme does not guarantee that a later touch will hold or break.
Plan hypothetical position risk separately
Enter a hypothetical risk budget, protection distance, estimated per-unit costs and currency conversion multiplier. The planner estimates risk per unit, the maximum whole-unit quantity under that budget, and the resulting planned risk.
Read the supplied dashboard example: estimated risk of 3.00 per unit and a budget of 100.00 allow 33 whole units, giving 99.00 planned risk and 1.00 remaining. The arithmetic is 33 × 3.00 = 99.00. These figures illustrate the entered assumptions, not actual orders, fills or a recommended allocation.
Whole units are not automatically interchangeable with shares, futures contracts or broker lots. Confirm the instrument’s point value, contract multiplier, currency conversion, permissible quantity increments and margin requirements. The planner does not account for every market’s specifications or guarantee a maximum loss through gaps, slippage or illiquidity.
For separate calculations, use the stock position size calculator, futures position size calculator or forex position size calculator. Those tools also require correct inputs and their own assumption checks.
Read the completed-bar dashboard
The dashboard brings together:
- The classified trend and measured EMA change.
- ATR-normalized EMA change and the ATR reading.
- Upper and lower wick proportions.
- Historical range context.
- Estimated risk per unit, maximum whole units, planned risk and remaining budget.
In the supplied Microsoft 5-minute screenshot, the completed trend is Bearish while the risk planner shows a separate hypothetical sizing calculation. A bearish context reading is not an automatic short entry, and a displayed size does not mean a trade was taken.
Configure alerts for confirmed observations
Available alerts cover confirmed inside bars, large-range candles and transitions into strong bullish or strong bearish context. Choose the event you want to monitor and review the alert frequency alongside the indicator’s completed-bar behavior. A context transition is different from a qualified trade entry.
After changing indicator inputs or updating the script, recreate saved TradingView alerts so their stored configuration matches your intended settings.
Getting started
- Open the published indicator on TradingView and add it to the chart.
- Adjust EMA and ATR settings for the instrument and timeframe being studied.
- Read the trend classification and candle observations separately.
- Enter a hypothetical budget, protection distance, cost allowance and appropriate conversion multiplier.
- Independently check contract or lot specifications, margin and execution assumptions.
- Configure the confirmed observation alerts you need, then compare the display across different market conditions.
What the indicator does not do
It does not identify automated entries, place stops or profit targets, detect second-entry patterns, reproduce discretionary channels, backtest trades or simulate fills. A protection-distance input is part of a hypothetical risk calculation, not a stop order submitted to a broker.
Strong trend labels describe a particular mathematical definition. They do not guarantee continuation, a suitable setup or profitable results. Historical measurements and a tidy dashboard are not evidence of a verified win rate or trading edge.
Common questions
Is Strong Bullish a buy signal?
No. It means the selected trend-classification conditions are satisfied. Entry selection and execution are outside this indicator’s purpose.
Are the rolling levels discretionary support and resistance?
No. They measure previous price extremes over the configured historical range rather than recreating hand-drawn levels or channels.
Does the risk planner cap my actual loss?
No. It estimates risk from the entered distance, costs and conversion assumptions. Gaps, slippage, liquidity, instrument specifications and margin can produce outcomes outside that estimate.
Can I run this Pine Script in the daily strategy tester?
No. CandleChasers’ tester supports selected daily stock rules. It does not execute arbitrary Pine Script or turn this indicator’s dashboard into a backtested strategy.
For another approach to market environment and setup qualification, explore Market State Engine. For independent moving-average comparisons, see 40 Moving Averages.
Open Strong Trend & Risk Planner on TradingView ↗ (paid link)Educational and analytical purposes only. Not personalized financial advice. We may earn a commission if you purchase through our TradingView links.